lod
The length-of-day data (LOD) is from 1 January 1964 to 31 December 1999. LOD (or part of it) has previously been studied by many researchers. A common approach in previous studies was to use Fourier spectrum analysis to identify the spectrum peaks. With the consideration of possible quasiperiodic response to periodic forcing (e.g., the tidal effect caused by revolution of the Moon around the Earth), one designs band-pass filters to isolate various physically meaningful quasiperiodic components. However, the filtered results are usually sensitive to the structures of band-pass filters, and often, a posteriori calibration is needed to obtain ‘‘neat’’ results with ‘‘neatness’’ judged by the a priori knowledge a researcher has on the possible mechanisms involved in the change of LOD. An even more serious problem is that a filtered component for any earlier period may be changed if later data are added for the calculation of the spectrum of the data and the same filter is reapplied to obtain the component. Furthermore, most frequency domain filters are linear. If the waveforms are distorted by nonlinear processes, the bandpass filter could only pick up the fundamental mode and could leave out all the needed harmonics to reconstitute the full waveforms. These drawbacks raise concerns about the reliability of the filtered components and, consequently, the corresponding scientific interpretations.
The locality and adaptivity of HHT overcome the drawbacks described above. The a priori knowledge of the physical mechanisms behind LOD is no longer needed; the filtered components of their local periods smaller than data length would not be affected by adding data later on; and the need for multiple filters to isolate components of different timescales is no longer necessary.
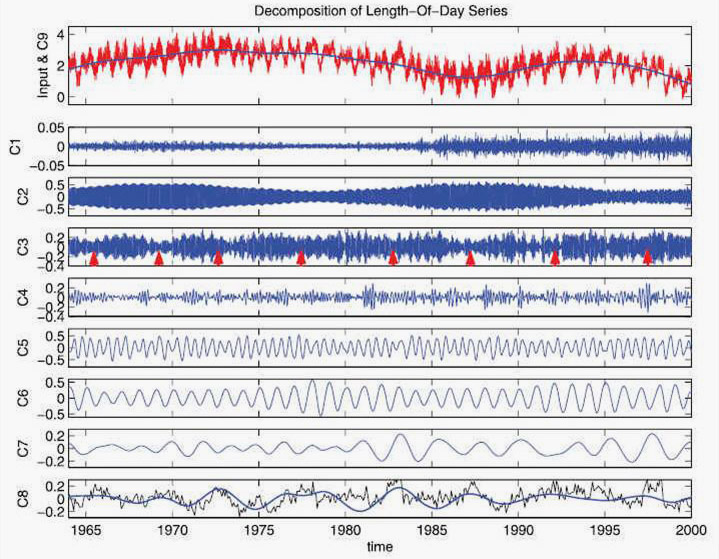
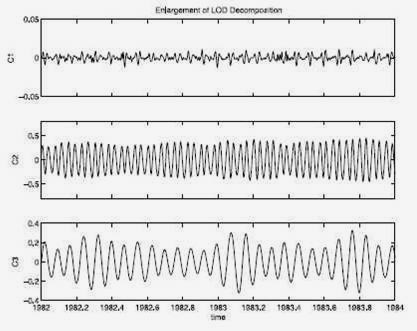
The LOD data and its EEMD decomposition are displayed in Figure 1 and in Figure 2, which is an enlargement of Figure 1 from January 1982 to December 1983 for the first three components. In this decomposition, some standard postprocessing schemes, such as combination of neighboring components and additional EMD decomposition of EEMD outputs are applied. In Figure 1, eight IMF-like components (C1 and C5) and IMFs (C2–4 and C6–8) are presented, as well as the low-frequency component displayed over the LOD data.
The first component, C1, has an averaged amplitude 1 order smaller than any other components. It has quasiregular spikes with an average period around 14 d superimposed on random high-frequency oscillations. These random high-frequency oscillations may be related to weather storms. The second component, C2, has an average period of about 14 d, which was linked to semimonthly tides. The amplitude of C2 has small semiannual modulation superimposed on a 19-year modulation. The 19-year modulation is believed to be related to the Metonic cycle. C3 has an average period of about 28 d, which was linked to monthly tides. Its amplitude appears to be relatively small in El Nin˜o years, as indicated by the red arrows in Figure 1. The fourth component, C4, is a component with periods between a month and one-half year, with a relatively smaller averaged amplitude that is only a fraction of those of other components excluding C1. C5 and C6 are semiannual and annual components, respectively. The causes of these cycles in length of day have been attributed to both the semiannual and annual cycles of the atmospheric circulation and to other factors, such as tidal strength change related to the revolution of the Earth around the Sun.
The next two components are the variations between interannual timescales. C7 is quasi-biannual, and C8 has an average period slightly longer than 4 years. In previous studies, it was documented that in El Nin˜o years, the length of day tended to be longer. Here we present a systematic phase locking of C8 to the El Nin˜o phenomenon, which is represented by the sign-flipped Southern Oscillation Index (with amplitude reduced to 1/10).
The locality and adaptivity of HHT overcome the drawbacks described above. The a priori knowledge of the physical mechanisms behind LOD is no longer needed; the filtered components of their local periods smaller than data length would not be affected by adding data later on; and the need for multiple filters to isolate components of different timescales is no longer necessary.
 |
| Figure 1. Ensemble empirical mode decomposition of the length-of-day data (the red line in the top plot) from 1 January 1964 to 31 December 1999. In the decomposition, noise of standard deviation 0.2 is added for the ensemble calculation, and the ensemble number is 800. The direct output (D1–D13, not shown here) of the decomposition has been reprocessed with combination of its components and additional EMD calculation. C1 is D1; C2 is the first mode of the combination of D2 and D3 subjected to additional EMD; the difference (D2 + D3 - C2) is added to D4; and the sum is subject to an additional EMD to obtain C3. The left over in this decomposition is added to D5 and D6. This latter sum is decomposed using an additional EMD to obtain C4 and C5. The sum of D7, D8, and D9 is decomposed using an addition EMD to obtain C6, C7, and C8. D10–D13 are combined and displayed as the blue line in the top plot. |
 |
| Figure 2. Enlargements of the first three components displayed in Figure 1 for the period from 1 January 1982 to 31 December 1983. |
The LOD data and its EEMD decomposition are displayed in Figure 1 and in Figure 2, which is an enlargement of Figure 1 from January 1982 to December 1983 for the first three components. In this decomposition, some standard postprocessing schemes, such as combination of neighboring components and additional EMD decomposition of EEMD outputs are applied. In Figure 1, eight IMF-like components (C1 and C5) and IMFs (C2–4 and C6–8) are presented, as well as the low-frequency component displayed over the LOD data.
The first component, C1, has an averaged amplitude 1 order smaller than any other components. It has quasiregular spikes with an average period around 14 d superimposed on random high-frequency oscillations. These random high-frequency oscillations may be related to weather storms. The second component, C2, has an average period of about 14 d, which was linked to semimonthly tides. The amplitude of C2 has small semiannual modulation superimposed on a 19-year modulation. The 19-year modulation is believed to be related to the Metonic cycle. C3 has an average period of about 28 d, which was linked to monthly tides. Its amplitude appears to be relatively small in El Nin˜o years, as indicated by the red arrows in Figure 1. The fourth component, C4, is a component with periods between a month and one-half year, with a relatively smaller averaged amplitude that is only a fraction of those of other components excluding C1. C5 and C6 are semiannual and annual components, respectively. The causes of these cycles in length of day have been attributed to both the semiannual and annual cycles of the atmospheric circulation and to other factors, such as tidal strength change related to the revolution of the Earth around the Sun.
The next two components are the variations between interannual timescales. C7 is quasi-biannual, and C8 has an average period slightly longer than 4 years. In previous studies, it was documented that in El Nin˜o years, the length of day tended to be longer. Here we present a systematic phase locking of C8 to the El Nin˜o phenomenon, which is represented by the sign-flipped Southern Oscillation Index (with amplitude reduced to 1/10).
