HHT CaseStudy
Bridge Structural Health Monitoring
An ideal inspection method for nondestructive bridge health monitoring would have to satisfy the following conditions:
1. be robust, objective, and reliable,
2. be able to identify the existence of damage,
3. be able to locate the damage,
4. be able to determine the degree of damage, and
5. be able to provide data to estimate the remaining period of service
Current available methods include visual inspection, acoustic or ultrasonic emission monitoring, infrared thermography, ground-penetrating radar, eddy current detection and others. However, all of them have drawbacks and fail the above requirements. The only viable alternative is to use dynamic response and the changes in the bridge’s vibration characteristics. Traditionally, the proper frequency can be computed only through Fourier analysis, from which the time domain data are reduced to purely frequency domain results, yet Fourier analysis is physically meaningful only for linear and stationary data. All real structures are seldom linear, especially when the structure is damaged to the extent where the response could be plastic. The lack of a nonlinear and nonstationary signal-processing method has made this random-vibration approach inconclusive.
Given all the shortcomings of the available methods, Hilbert-Huang transform (HHT)-based method is developed for nondestructive instrument structure health monitoring. The HHT-based method enjoys many advantages: no a priori data required, simple data collection, minimum traffic disruption with transient load, and precise and nuance quantitative answers. The essence of the method is HHT for nonstationary and nonlinear time, which consists of the empirical mode decomposition and Hilbert spectral analysis. The final decision on the health of the bridge structure is based on two criteria.
1. The first criterion detects the nonlinear characteristic of the intra-wave frequency modulations of the bridge response, which usually appears during comparison of light with heavy loads.
2. The second criterion detects the frequency downshift as an indication of structural yield.
Thus not only the existence and location of the damage can be detected, but also the severity of the damage can be quantified.
A bridge in southern Taiwan has applied HHT-based method for structural health field test. This bridge is a two-lane pre-stressed concrete girder bridge with 12 spans each 30m in length. The girders are simply supported between piers, but the bridge deck is continuous with 15cm reinforced concrete over three spans. There is a construction joint at every three spans.
During the test, a tri-axial force balance Kinemetrics EpiSensor accelerometer was used. For the bridge deck, the sensor was installed at the mid span; for the piers, the sensor was installed on the pier cap. The test loads employed were the regular traffic flow with vehicles of various sizes and speeds. The procedure of the test was to wait for a single vehicle to pass by and record the vibration generated by it.
Figure 2 gives the recorded vertical component of the acceleration as recorded by the accelerometers located at the middle of span numbers 2 and 4. The recorded acceleration signals vary over a large range. The different colors of the signal represent different weight of the test load. In general, the larger of the amplitude, the heavier of the load. In fact, the signal from a small light car (red, the first signal) is not even as big as the noise of the large heavy truck (light blue, the last signal). This result could have been realized only as a consequence of the transient loading.
The Hilbert spectrum from the EEMD is shown in Figure 3. All basic frequency traces are continuous in the time–frequency space. There is no mode mixing and frequency gaps. This implies that the adaptive representation may be a better choice to represent the essence of voice and the popular harmonic representation of voice.
The above figure shows the results of the marginal spectra for spans 4 and 2. Span 2 is clearly linear under all the loads. For span 4, the peak of the energy is still centered around 4Hz as span 2. Only under the heaviest, does the spectral form widen slightly, indicating a nonlinear reaction by the onset of intra-wave frequency modulations: this reaction indicates the deformation of the vibration waveform under the heavy load. As the central value stays at the same location, the structure should still be sound, although it is under extreme stress, and care should be paid to its operational condition. Perhaps a limitation on load and/or speed should be considered.
Figure 4 shows the data obtained from both piers 1 and 2 when a heavy truck passed over the bridge. These data do not indicate any drastic difference between different piers. Figure 5 shows the marginal Hilbert spectra together with the Fourier spectra. The Fourier spectra reveals no substantial difference between the two piers. The spectra might have small amplitude changes, but unfortunately, amplitude is not a good discriminator for problems. The Hilbert marginal spectra, however, shows drastic changes: the peak frequency for pier 2 is at 1.2Hz, which that for pier 1 is at 1.6Hz, a clear downshift of the vibration frequency and a clear indication of softening of the structure. As the frequency is proportional to the square root of the stiffness of the structure, the ratio of 1.6Hz to 1.2Hz indicate that the stiffness has changed in proportionality from 16 to 9, a reduction of almost 50%. Visual inspection of the pier indeed found the piling of pier 2 exposed through erosion. The reduction of the stiffness for pier 2 is a serious condition, warranting immediate remedial actions.
An ideal inspection method for nondestructive bridge health monitoring would have to satisfy the following conditions:
1. be robust, objective, and reliable,
2. be able to identify the existence of damage,
3. be able to locate the damage,
4. be able to determine the degree of damage, and
5. be able to provide data to estimate the remaining period of service
Current available methods include visual inspection, acoustic or ultrasonic emission monitoring, infrared thermography, ground-penetrating radar, eddy current detection and others. However, all of them have drawbacks and fail the above requirements. The only viable alternative is to use dynamic response and the changes in the bridge’s vibration characteristics. Traditionally, the proper frequency can be computed only through Fourier analysis, from which the time domain data are reduced to purely frequency domain results, yet Fourier analysis is physically meaningful only for linear and stationary data. All real structures are seldom linear, especially when the structure is damaged to the extent where the response could be plastic. The lack of a nonlinear and nonstationary signal-processing method has made this random-vibration approach inconclusive.
Given all the shortcomings of the available methods, Hilbert-Huang transform (HHT)-based method is developed for nondestructive instrument structure health monitoring. The HHT-based method enjoys many advantages: no a priori data required, simple data collection, minimum traffic disruption with transient load, and precise and nuance quantitative answers. The essence of the method is HHT for nonstationary and nonlinear time, which consists of the empirical mode decomposition and Hilbert spectral analysis. The final decision on the health of the bridge structure is based on two criteria.
1. The first criterion detects the nonlinear characteristic of the intra-wave frequency modulations of the bridge response, which usually appears during comparison of light with heavy loads.
2. The second criterion detects the frequency downshift as an indication of structural yield.
Thus not only the existence and location of the damage can be detected, but also the severity of the damage can be quantified.
A bridge in southern Taiwan has applied HHT-based method for structural health field test. This bridge is a two-lane pre-stressed concrete girder bridge with 12 spans each 30m in length. The girders are simply supported between piers, but the bridge deck is continuous with 15cm reinforced concrete over three spans. There is a construction joint at every three spans.
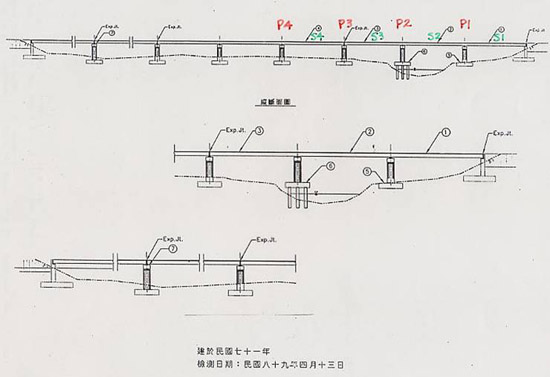 |
| Figure 1. A sketch of the bridge and test setup |
During the test, a tri-axial force balance Kinemetrics EpiSensor accelerometer was used. For the bridge deck, the sensor was installed at the mid span; for the piers, the sensor was installed on the pier cap. The test loads employed were the regular traffic flow with vehicles of various sizes and speeds. The procedure of the test was to wait for a single vehicle to pass by and record the vibration generated by it.
Figure 2 gives the recorded vertical component of the acceleration as recorded by the accelerometers located at the middle of span numbers 2 and 4. The recorded acceleration signals vary over a large range. The different colors of the signal represent different weight of the test load. In general, the larger of the amplitude, the heavier of the load. In fact, the signal from a small light car (red, the first signal) is not even as big as the noise of the large heavy truck (light blue, the last signal). This result could have been realized only as a consequence of the transient loading.
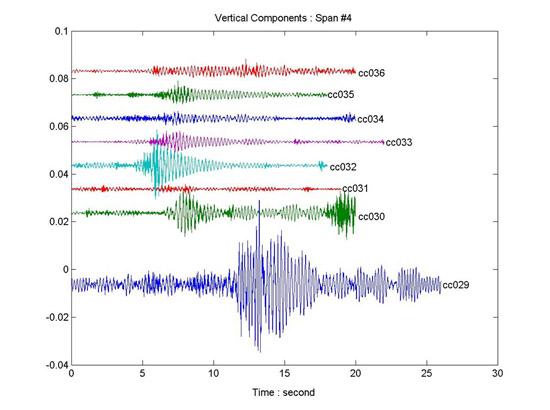 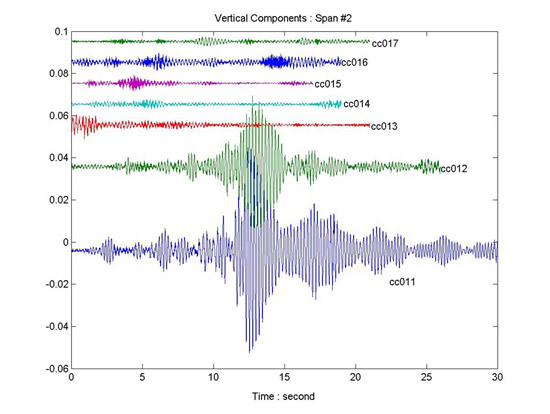 |
| Figure 2. The raw vibration data collected with an accelerometer at the span s4 (top) and span s2 (bottom). Different color represents the different weight of the load. |
The Hilbert spectrum from the EEMD is shown in Figure 3. All basic frequency traces are continuous in the time–frequency space. There is no mode mixing and frequency gaps. This implies that the adaptive representation may be a better choice to represent the essence of voice and the popular harmonic representation of voice.
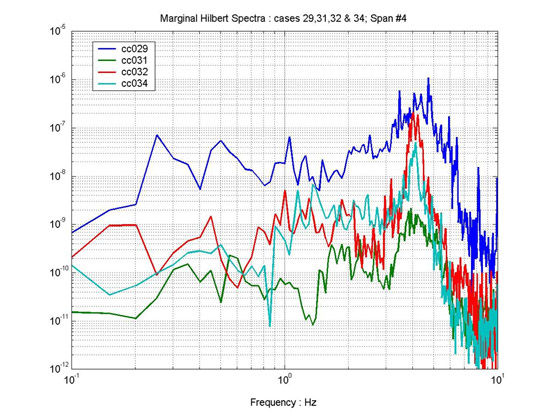 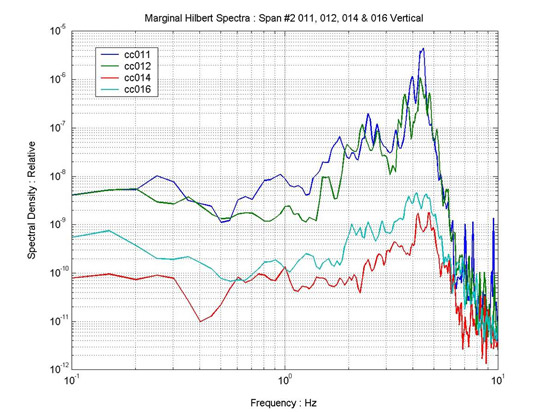 |
| Figure 3. The marginal Hilbert spectra for the acceleration data for span s4 (top) and span s2 (bottom). |
The above figure shows the results of the marginal spectra for spans 4 and 2. Span 2 is clearly linear under all the loads. For span 4, the peak of the energy is still centered around 4Hz as span 2. Only under the heaviest, does the spectral form widen slightly, indicating a nonlinear reaction by the onset of intra-wave frequency modulations: this reaction indicates the deformation of the vibration waveform under the heavy load. As the central value stays at the same location, the structure should still be sound, although it is under extreme stress, and care should be paid to its operational condition. Perhaps a limitation on load and/or speed should be considered.
Figure 4 shows the data obtained from both piers 1 and 2 when a heavy truck passed over the bridge. These data do not indicate any drastic difference between different piers. Figure 5 shows the marginal Hilbert spectra together with the Fourier spectra. The Fourier spectra reveals no substantial difference between the two piers. The spectra might have small amplitude changes, but unfortunately, amplitude is not a good discriminator for problems. The Hilbert marginal spectra, however, shows drastic changes: the peak frequency for pier 2 is at 1.2Hz, which that for pier 1 is at 1.6Hz, a clear downshift of the vibration frequency and a clear indication of softening of the structure. As the frequency is proportional to the square root of the stiffness of the structure, the ratio of 1.6Hz to 1.2Hz indicate that the stiffness has changed in proportionality from 16 to 9, a reduction of almost 50%. Visual inspection of the pier indeed found the piling of pier 2 exposed through erosion. The reduction of the stiffness for pier 2 is a serious condition, warranting immediate remedial actions.
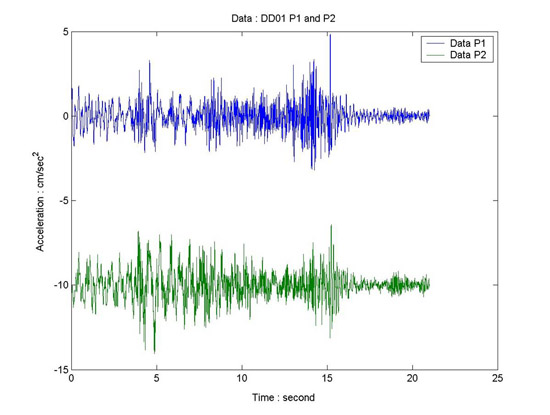 |
| Figure 4. The raw vibration data collected with an accelerometer at the pier caps #1 (top) and #2 (bottom) under a heavy load. The “P2” data has been offset by -10. |
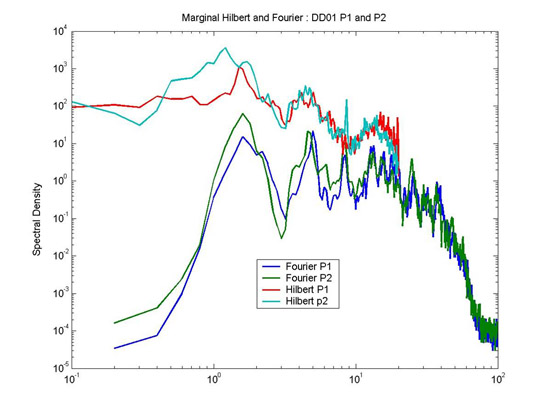 |
| Figure 5. The marginal Hilbert and the Fourier spectra from the acceleration data collected at the pier caps. Note that frequency downshift revealed from the Hilbert spectra, but not in the corresponding Fourier spectra. |
